Japan restaurant data shows tough conditions persisting for the hospitality industry
TableCheck releases the latest data analysis on the COVID-19 Pandemic and its effects on Japan's restaurant industry. This blog shows the aggregated data up to June 6, 2021.
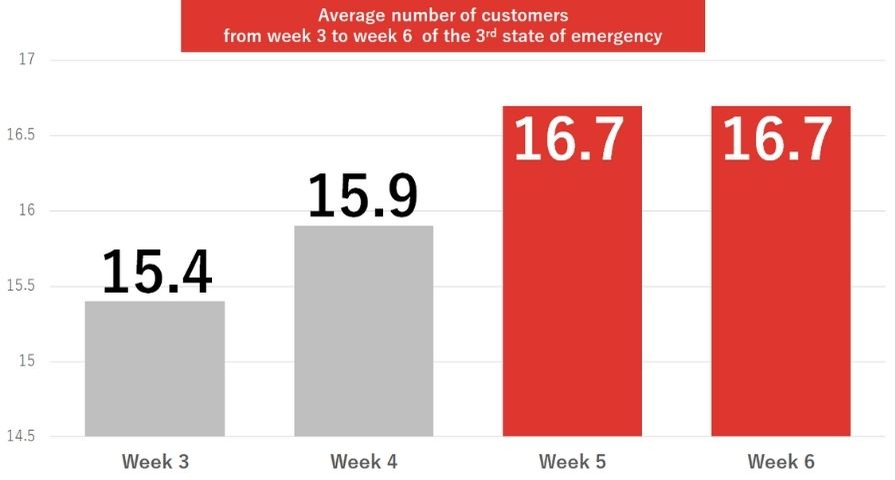
The data shows the average diners per restaurant remained flat at 16.7 with no bounce or changes since the previous week.
Weekly Average number of customers per restaurant under the 3rd state of emergency
Week 1:22.2 persons/restaurant
Week 2:24.3 persons/restaurant (Long holidays)
Week 3:15.4 persons/restaurant (State of emergency declared)
Week 4:15.9 persons/restaurant
Week 5:16.7 persons/restaurant
Week 6:16.7 persons/restaurant
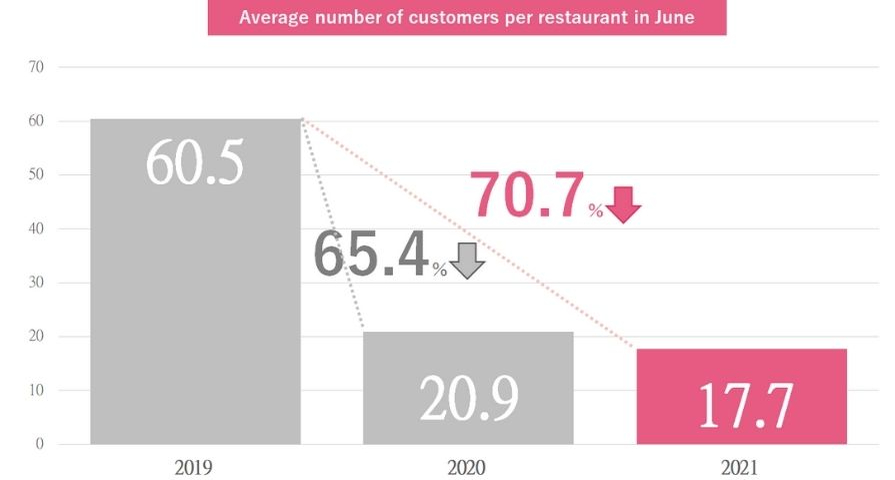
There is an underlying fear that a repetition of “self-restraint requests” has educated the public to boycott restaurants on a long-term basis. The reality of this is yet to come clear, however worrying signals indicate the average number of customers per restaurant has already decreased by 16% when compared directly to same period last year. At that time when the first state of emergency lifted, hospitality rebounded. Now conditions are expected to remain unpredictable for restaurants this year.
READ MORE: Data analysis of average customer visits in areas subjected to the State of Emergency and other policies per region | Impact of shortened business hours in the restaurant industry
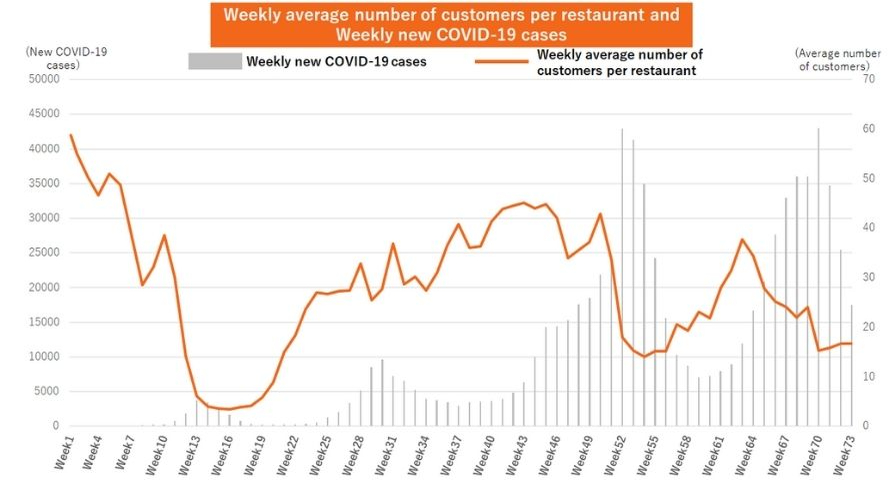
73 weeks since COVID-19, restaurants continue to suffer due to ambiguous regulations
READ MORE: Survey summary from the restaurant industry responding to the shortened business hour regulation as of 8 of January 2021 is shared below (published January 2021)
It has been 73 weeks since the first case of COVID-19 was confirmed in Japan on 1 of January 2020. However, the customer flow of restaurants are still at sluggish recovery.
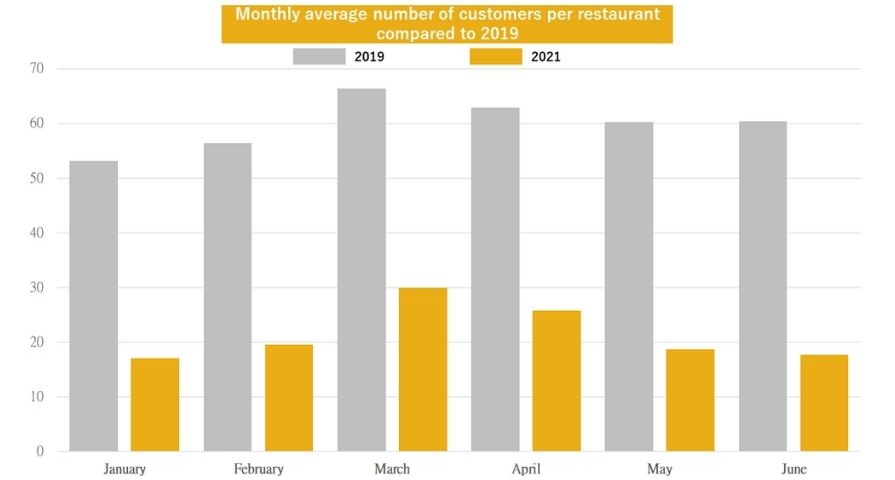
Despite the repetition of starting and ending people’s self-quarantine caused by the three state of emergency declarations—policies that aim to prevent the spread of COVID-19 and governments’ stay-at-home requests in these one and a half years,—numbers of new infected cases have continued to increase, and number of customers have decreased by 70% compared to 2019, which leads to considerable damage to the restaurants.
If the Tokyo Olympics and Paralympics continue to be held as scheduled in the summer, the further spread of COVID-19 and the extension of self-restraint period is inevitable.